and Chasing
[Index][Archives]
Illawarra Severe Storms: Thursday 19th October 2000
by Jimmy Deguara
| Storm News and Chasing [Index][Archives] |
Illawarra Severe Storms: Thursday 19th October 2000 by Jimmy Deguara |
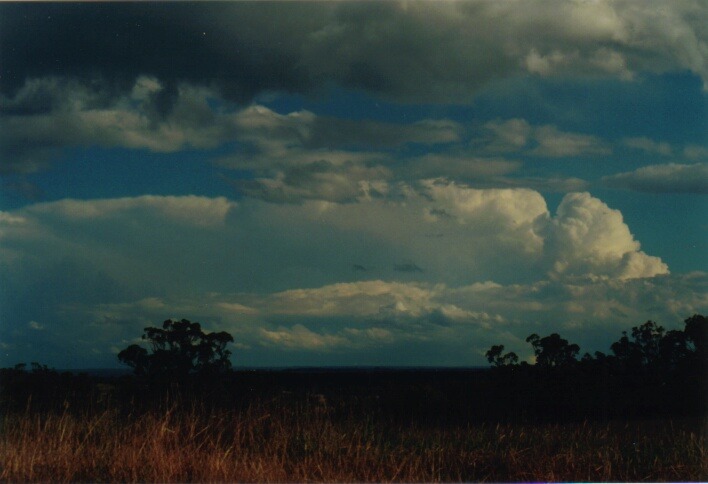
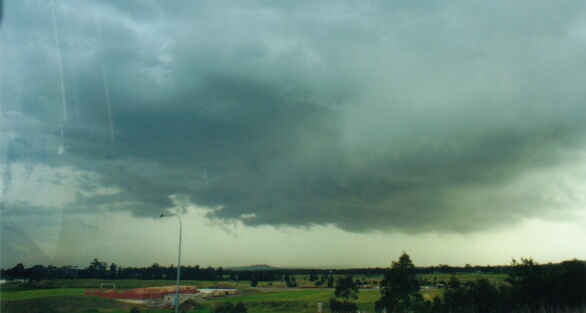
Although not the best of chases, the 19th October 2000 Illawarra severe storms were very impressive and photogenic. From observations and using evidence from data for that day, it is most likely that supercells occurred.
The day began with a rain band that cleared during the early afternoon revealing castellanus. The surface lifted index predicted values in the region mainly just south of the Illawarra were about -2 to -4, and perhaps -5 off the coast to the south of this region. The moisture profile was perfect with moist air in the lower layers provided by the rain band and drier air aloft. The Illawarra was to be in an area of the right exit region of an upper level subtropical jet. I had not checked into the conditions at the time but the lower level outflow from the band would provide the directional shear with north-northeasterly windshear. This provided perfect conditions for the development of severe storms, and supercells were definitely possible. My decision that morning though was purely based on the satellite picture - whether I should take my camera equipment ready to chase. One quick glance - Yes...
I noticed the cloud band had begun to clear during the early afternoon. It was evident that there was a distinct line on the satellite picture where cloud and moisture seemed to be trapped along the trough behind the clearing edge of the cloud band. Were others in ASWA watching these developments? That was quickly answered as the mobile phone went off with a call from Paul Graham whilst in the classroom. The students' reaction: "we are not allowed to have mobile phones in the classroom so why are you?" "Umm - Paul, I will call you later..."
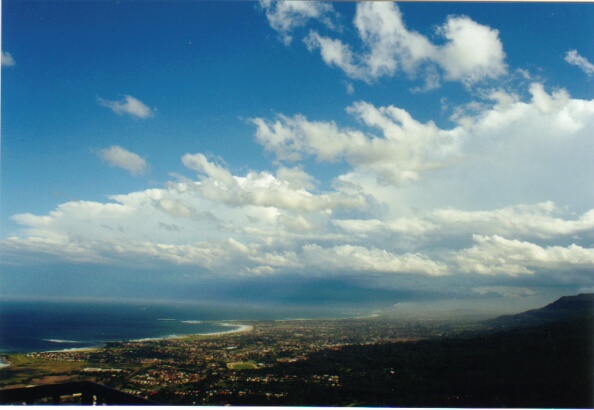
During the early afternoon, you could see towers rising to the far southwest. They had the orange tinge to them due to the haze. I was hoping they would not escape off the coast before I could leave work. I had to chair a quick meeting to give a survey - and boy did I make it quick!! I was on the road to Rooty Hill shortly after 3pm.
Well I never stopped
at Rooty Hill. I continued on to a lookout at Kemps Creek which had a slightly
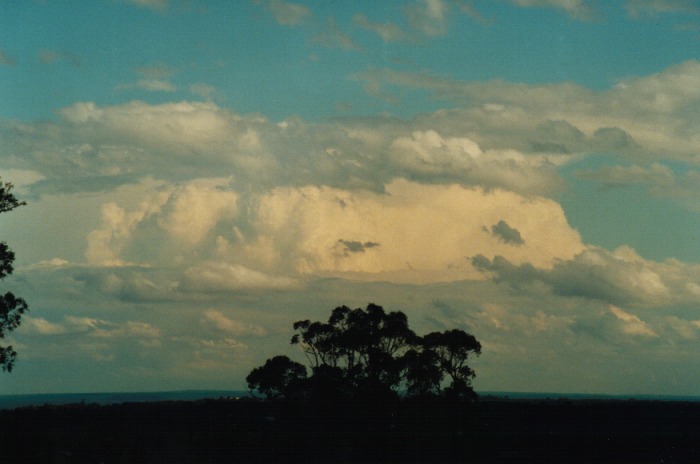
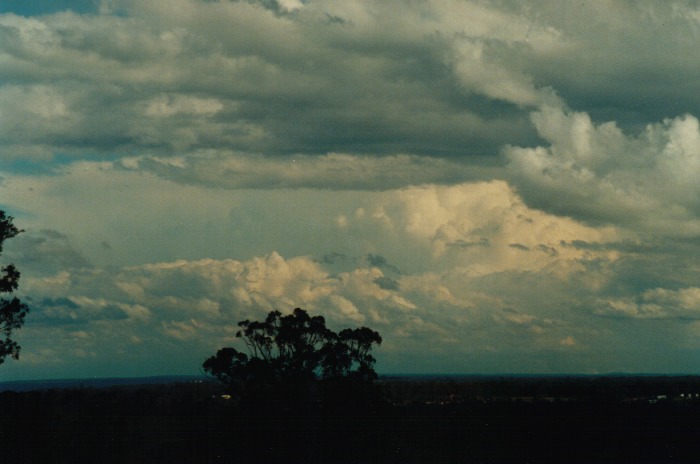
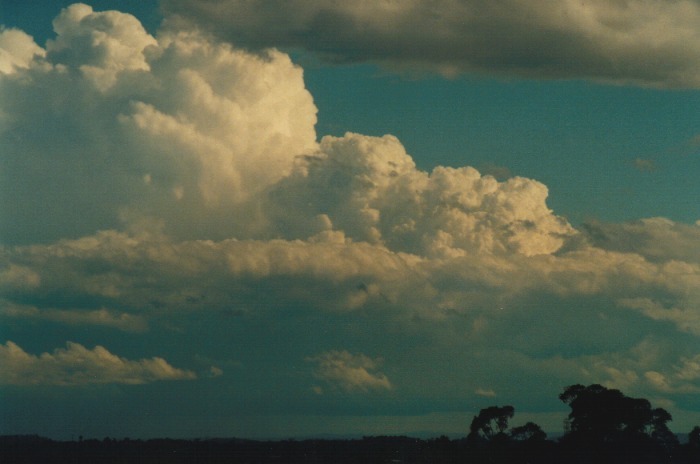
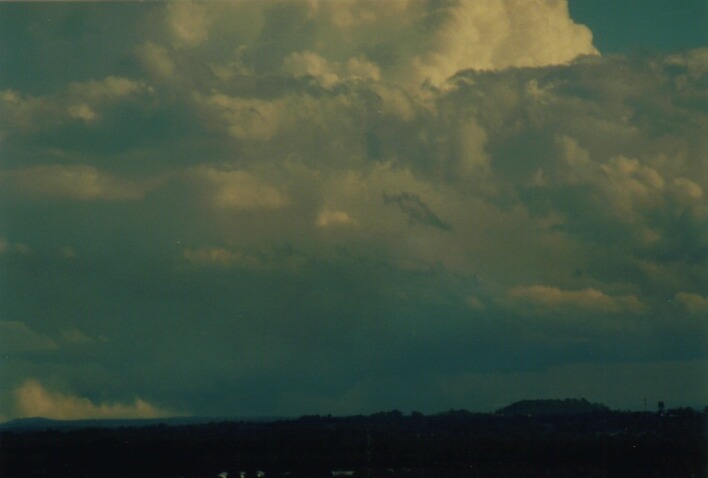
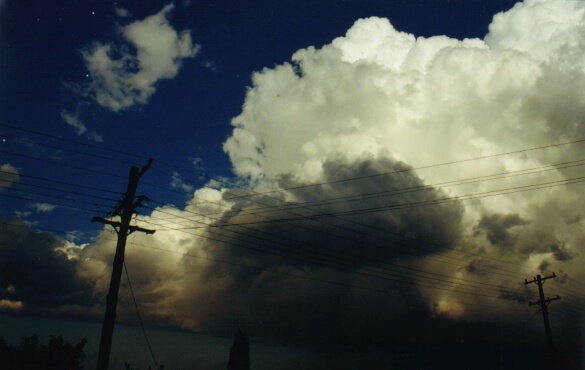
better southerly view. A major cumulonimbus cell had begun to explode. 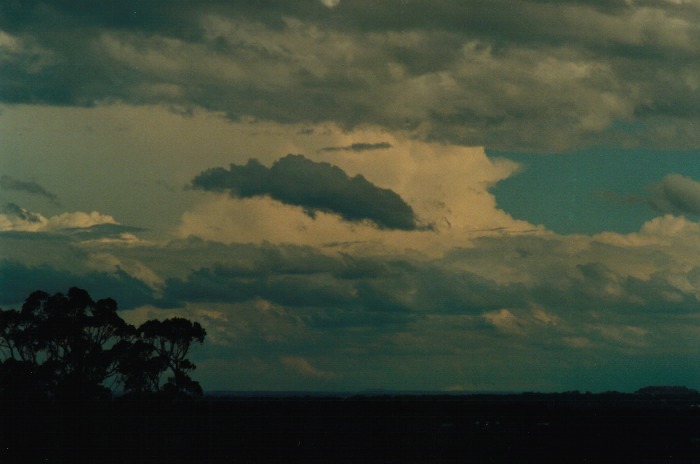
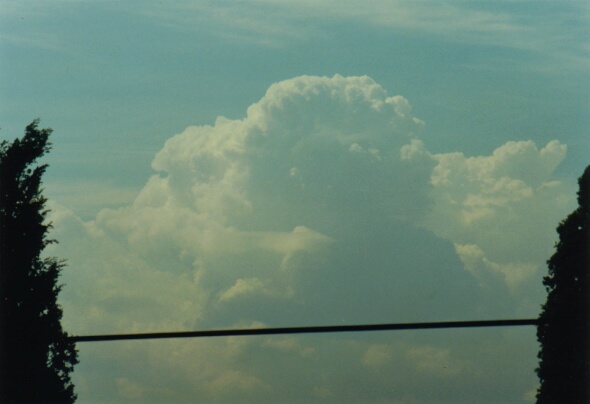
 It
is a well known fact that cells around Sydney normally would have flattened out
before making an attempt of breaking through but this cell had shot straight up
with a bulge at the top as the updraught hit the upper level inversion. The anvil,
although existent, seemed to not be able to spread out fast enough as the updraught
rose. With each strong updraught, there was evidence of attempted backshearing.
It
is a well known fact that cells around Sydney normally would have flattened out
before making an attempt of breaking through but this cell had shot straight up
with a bulge at the top as the updraught hit the upper level inversion. The anvil,
although existent, seemed to not be able to spread out fast enough as the updraught
rose. With each strong updraught, there was evidence of attempted backshearing.
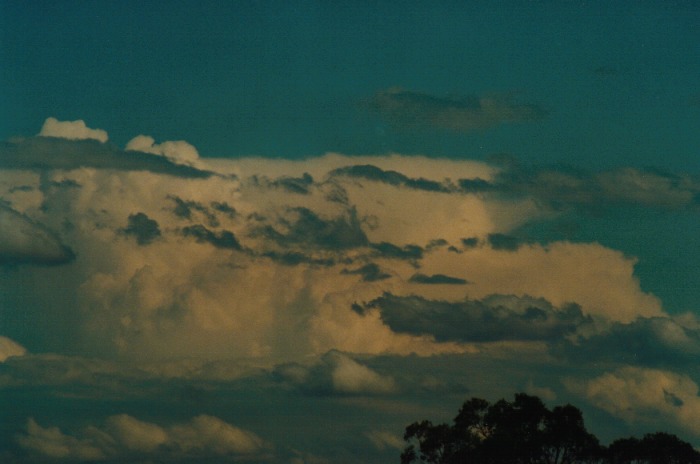
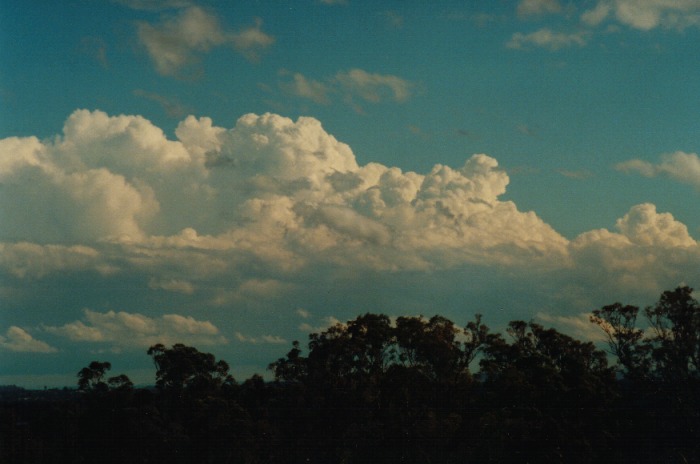
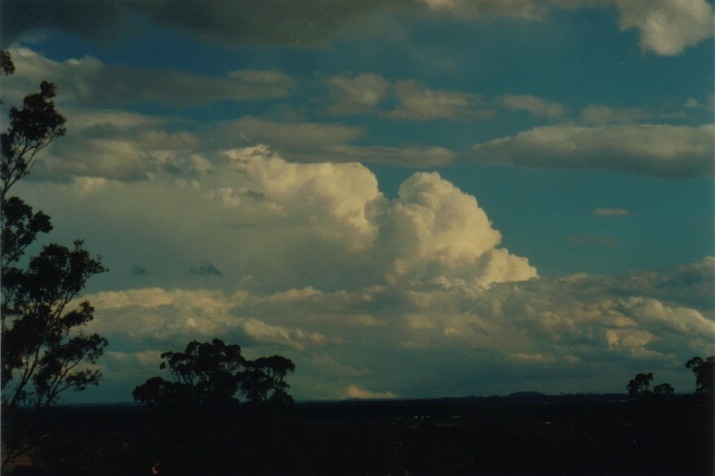
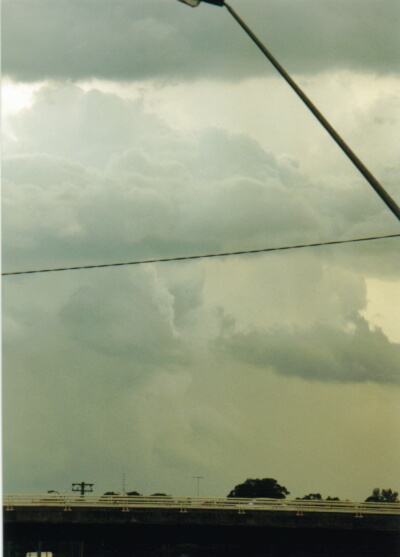
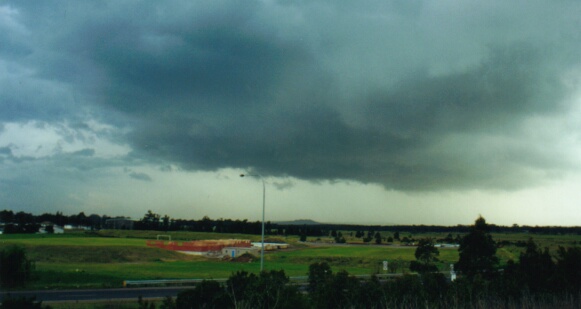
 I arrived at Kemps Creek and immediately took some photographs followed by some
video. It became clear that the storms were developing along a line (which had
shown on the satellite picture earlier). The tops of the cumulonimbus were crisp
and clear. Each updraught was powerful and would merge with the adjoining main
cell. The first cell was dominant and would have been literally exploding closer
to or off the coastline. The flanking line of this cell faced northwest to north.
There also was a fresh, moist north-northeasterly wind providing good inflow into
the storm. An easterly would have been more ideal.
I arrived at Kemps Creek and immediately took some photographs followed by some
video. It became clear that the storms were developing along a line (which had
shown on the satellite picture earlier). The tops of the cumulonimbus were crisp
and clear. Each updraught was powerful and would merge with the adjoining main
cell. The first cell was dominant and would have been literally exploding closer
to or off the coastline. The flanking line of this cell faced northwest to north.
There also was a fresh, moist north-northeasterly wind providing good inflow into
the storm. An easterly would have been more ideal.
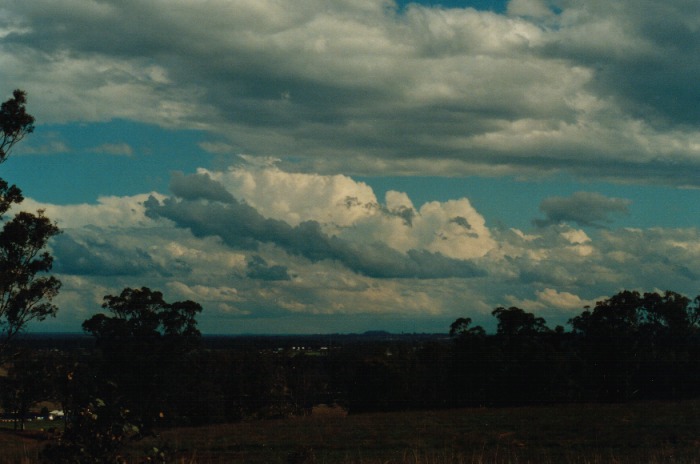
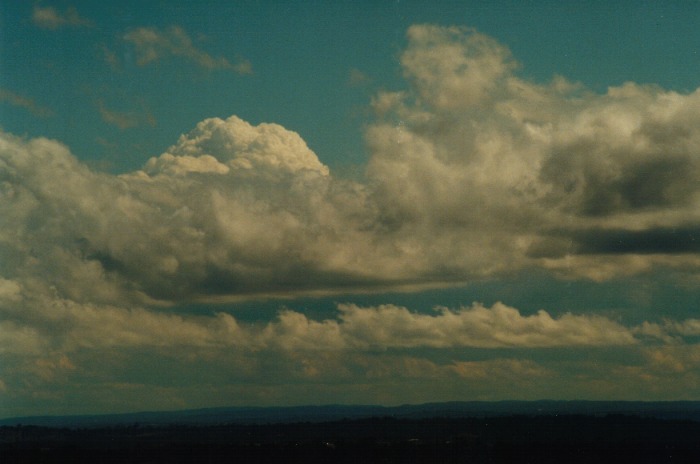
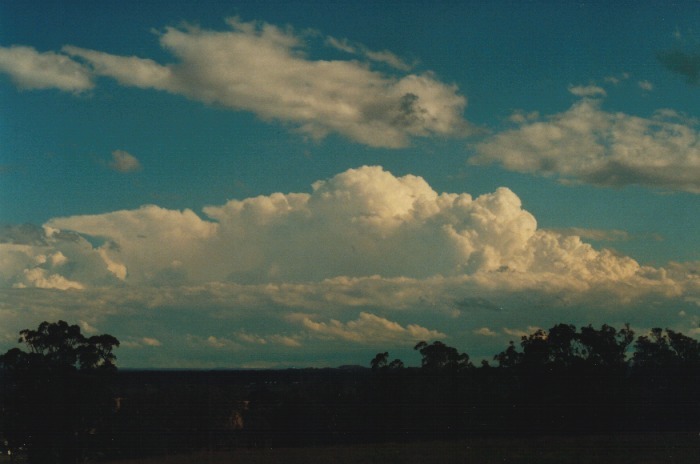
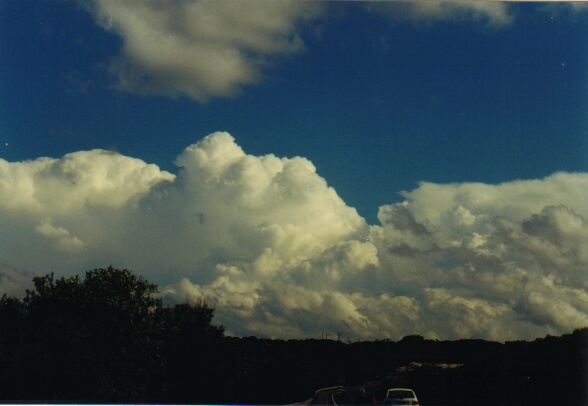
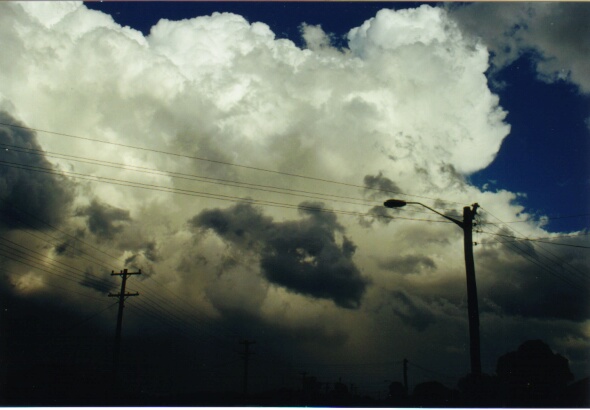
The towers immediately after the main cell were now also exploding and after a few updraughts developing into a second powerful cell. In the meanwhile, I kept my eye on what was developing to the west over the mountains. There were cumulus congestus towers everywhere and a nice base was developing. David Croan and Paul Graham were on their way. Matt Smith and Daniel Weatherhead had phoned and were on their way south.
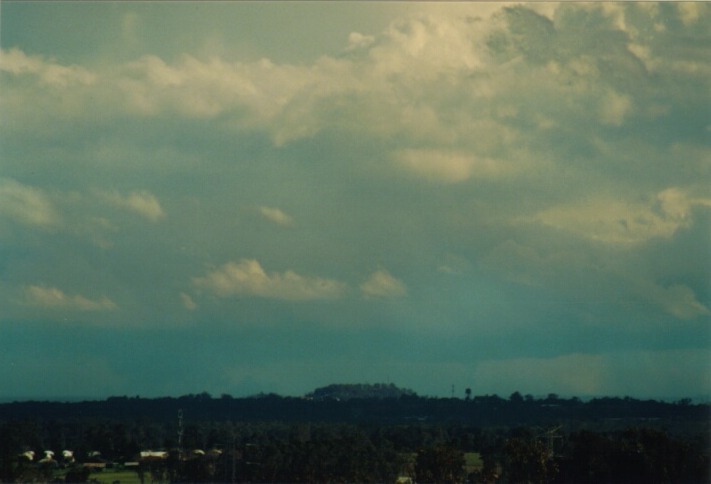
 Although
I was hoping that storms would develop in the Sydney region, it was Paul Graham
who pointed out that it seemed that drier air had moved through. Winds were northerly
at the surface but just above, there was a dry northwesterly wind penetrating
and this had developed a cap. What this meant was that if storms did develop in
Sydney they would have been strong storms but more surface heating would have
been necessary.
Although
I was hoping that storms would develop in the Sydney region, it was Paul Graham
who pointed out that it seemed that drier air had moved through. Winds were northerly
at the surface but just above, there was a dry northwesterly wind penetrating
and this had developed a cap. What this meant was that if storms did develop in
Sydney they would have been strong storms but more surface heating would have
been necessary.
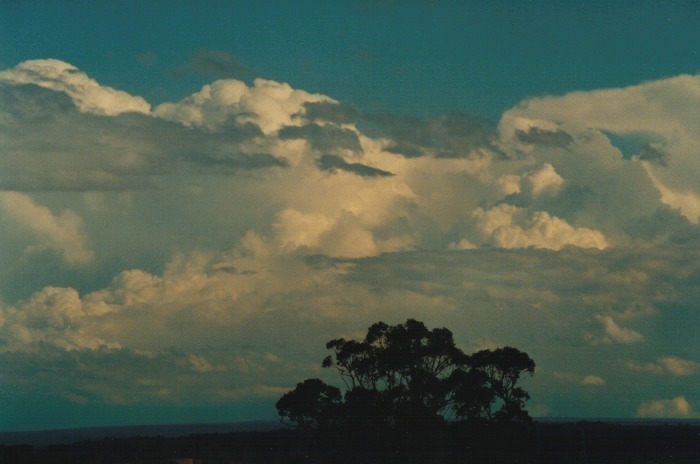
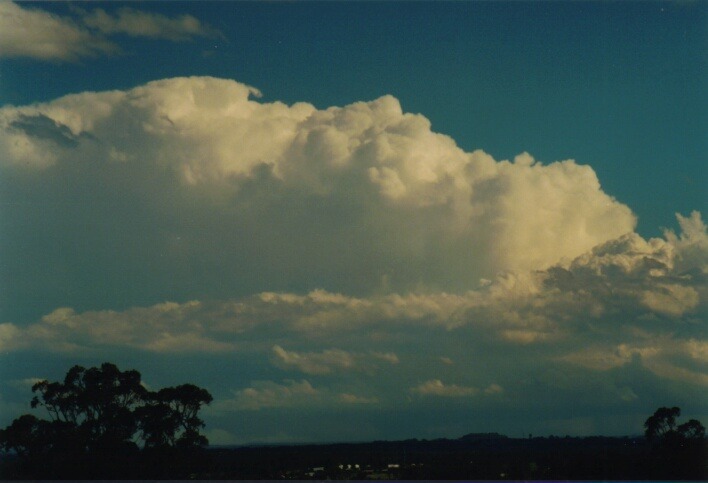
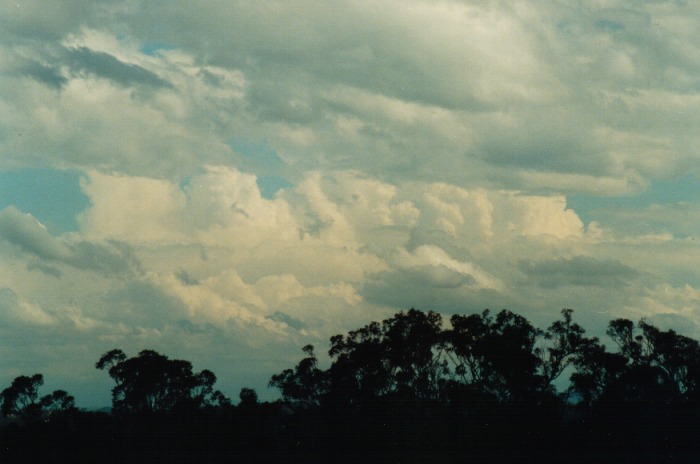
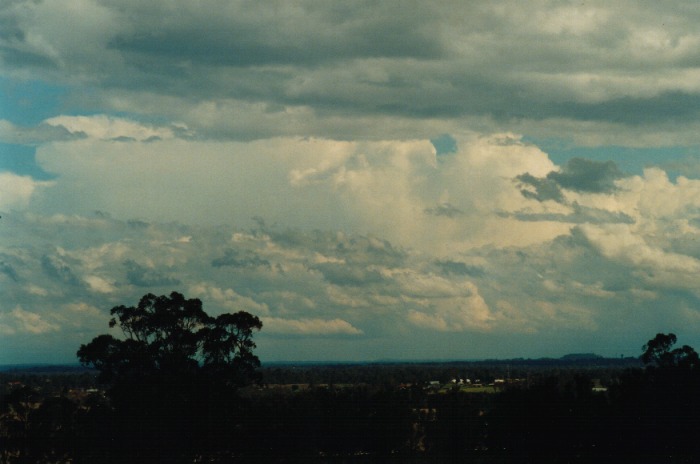
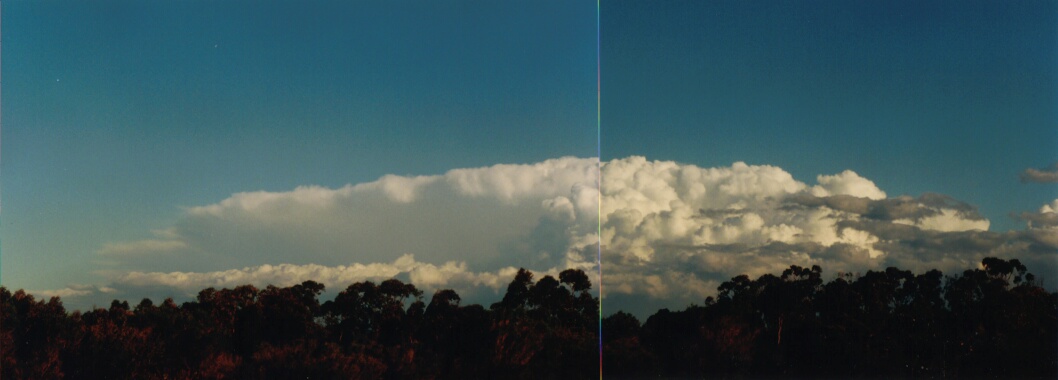
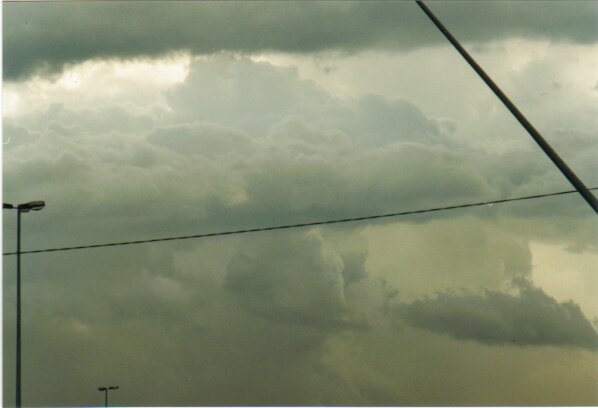
I was not too disappointed though as I had the opportunity to watch the Illawarra cells. And boy were they taking off!! They had merged into an elongated mass of severe activity. Knowing the shear conditions were ideal, I kept watching the base of the main updraughts and it seemed that one particular cell had a distinct lowering. From observations of the video Matt Smith had taken, the same lowering had produced a funnel cloud under a wall cloud. I was just too far away to observe it properly particularly due to sunlight interference.
Paul Graham, David Croan and I continued to observe this system until the storms began to move within the direction of a few unneeded obstacles - trees... We then decided to move to Horsley Hill. What a terrible mistake!!! The Paralympics were on and The Equestrian event was held there. I simply had no intention of scaling the 6 foot high gate and wrestling the guard to get to the lookout area!!!
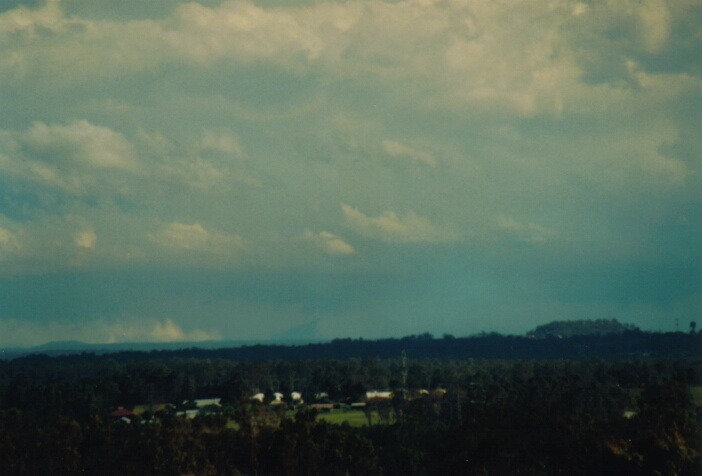
We had to settle for Rooty Hill. The supercellular system had exploded with a large v-notch region evident - a clear sign of upper level divergence. Unfortunately, Sydney was not to enjoy the action. So we settled to some evening supper at the Rooty Hill RSL and called it quits for the day. Several chasers including Mario Orazem also chased that day. Mario's pictures from a more northeasterly view point with respect to the storm.
It seems until it is verified by doppler radar, the several observations mentioned above seem to support that this storm system consisted of at least one, perhaps two supercells. These observations include:
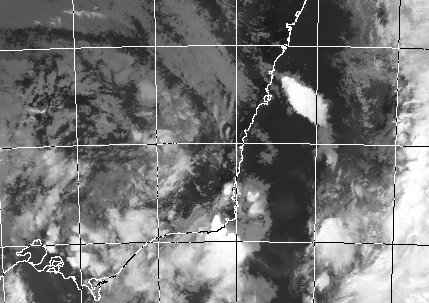
This image obtained
from Bureau of Meteorology.
11am local 19th October 2000

|
Document: 0010-02.html
Updated: 2nd November, 2001 |
[Australian Severe Weather index] [Copyright Notice] [Email Contacts] [Search This Site] |