and Chasing
[Index][Archives]
Lismore Flood Pictures and Wilsons River Flood Height Information / Richmond River Flood Plain
Report and all photos by Michael Bath
| Storm News and Chasing [Index][Archives] |
Lismore Flood Pictures and Wilsons River Flood Height Information / Richmond River Flood Plain Report and all photos by Michael Bath |
Skip to the photographs of flooding in and around the Lismore area.
Lismore Flooding - Introduction
 The Northern Rivers district of NSW, Australia is one of the most flood prone
areas of the country outside of the tropics. With Lismore at the junction of two
major streams - Leycester Creek and Wilsons River - it is often subject to significant
flooding.
The Northern Rivers district of NSW, Australia is one of the most flood prone
areas of the country outside of the tropics. With Lismore at the junction of two
major streams - Leycester Creek and Wilsons River - it is often subject to significant
flooding.
Topography and the alignment of the Northern NSW coast relative to prevailing weather patterns allows for prolonged orographically enhanced rainfall events from time to time - particularly during late Summer, Autumn and early Winter. During those months large slow-moving (blocking) high pressure systems are often positioned around 40 degrees south and provide a long fetch of moisture-laden southeast to easterly winds onto the North Coast. Flood producing heavy rainfall can occur if the high combines with a trough, low pressure system, tropical cyclone, upper trough / cold pool and even the monsoon trough. It is not essential for a strong 'blocking' high pressure system to help cause a flood, but it is nearly always present for the major events - as it keeps the rain producing systems in the same area longer. Some examples of flood producing weather patterns:
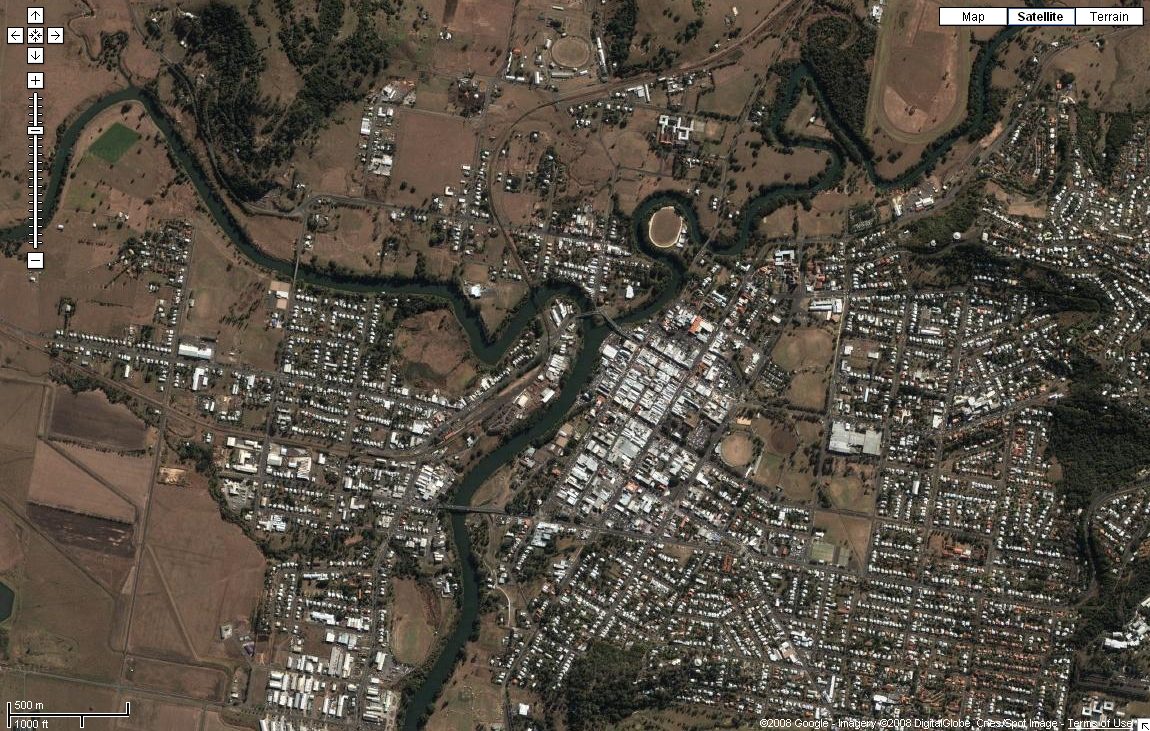
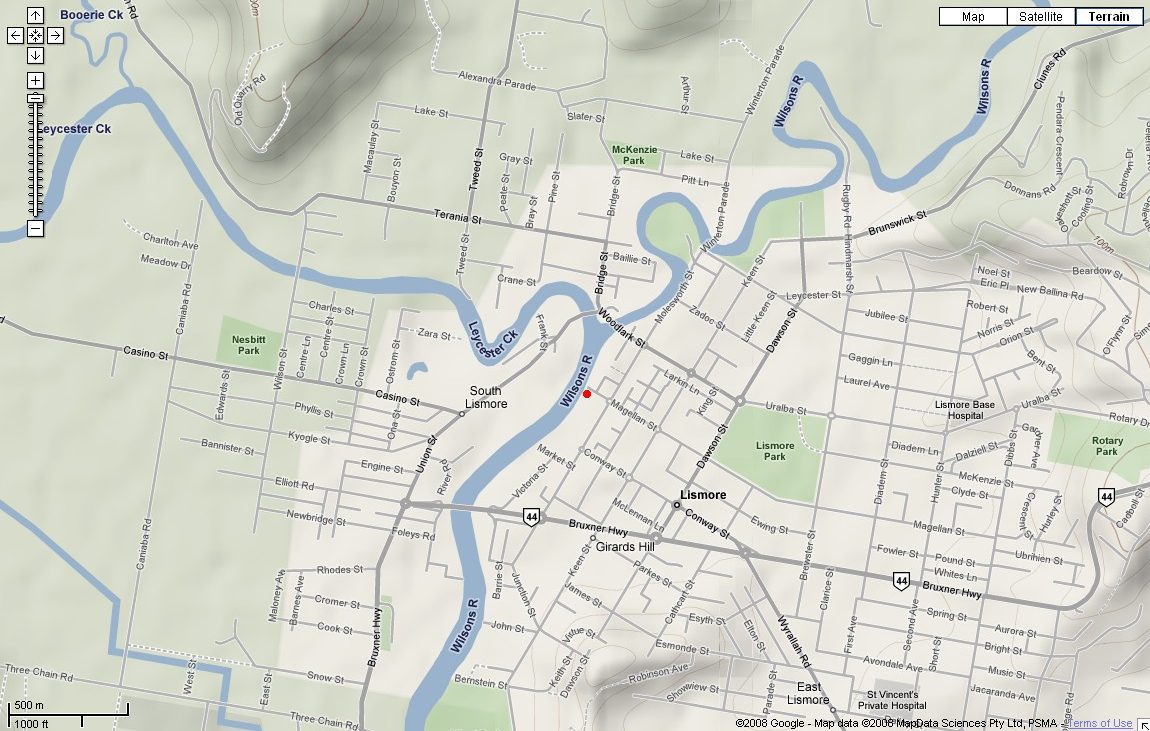
Lismore aerial photo and location map from Google Maps. Click for larger view.
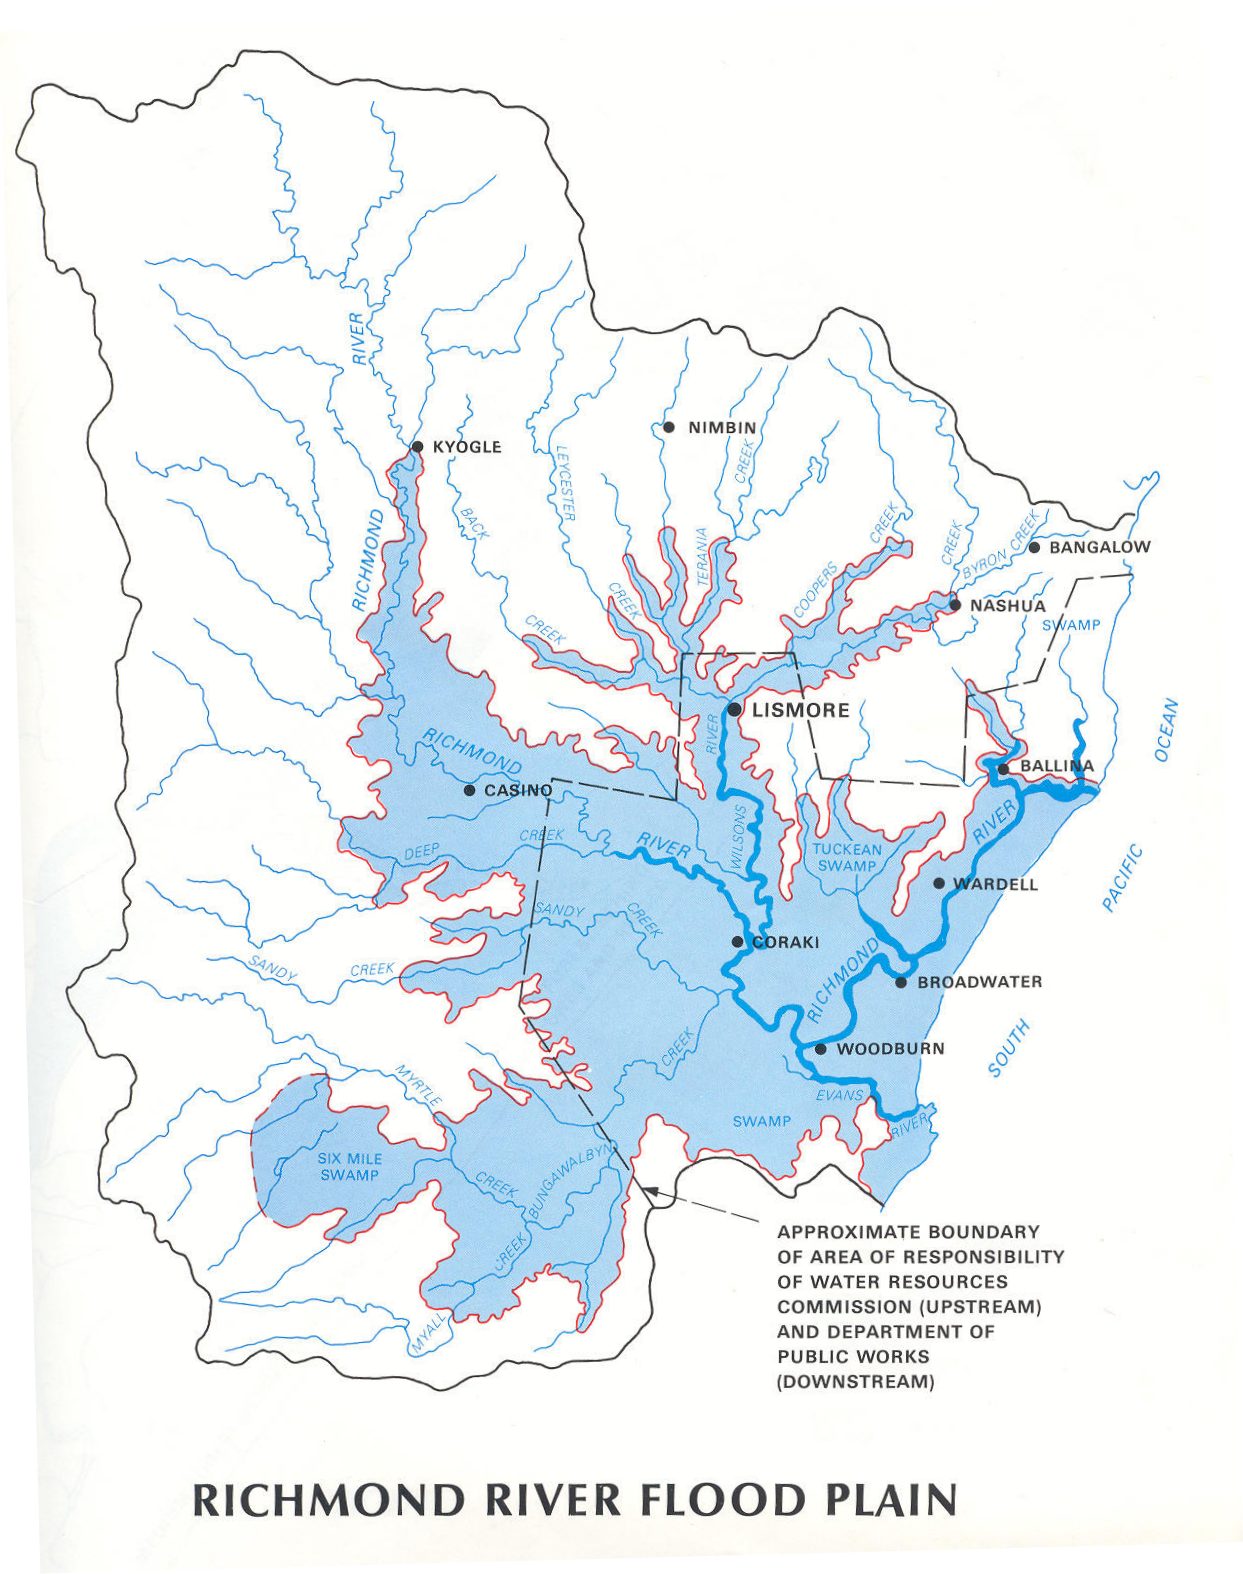
Richmond River Flood Plain and Catchment Maps
The Wilsons River, Leycester Creek and tributaries upstream from Lismore represent only about one-quarter of the Richmond River catchment, however the majority of flooding occurs in this area and through to Coraki. The Nightcap Range to the north of Lismore, and hills extending through Bangalow to near Alstonville often receive much higher rainfall than the rest of the region due to orographic effects and because it is closer to the coast and the source of rain-bearing clouds. The floodplain is also narrower due to hilly terrain. South and west of Lismore the terrain is quite flat and the floodplain very wide in comparison.
Major flooding of the Richmond River upstream from Coraki requires heavy rainfall west of the Nightcap and Border Ranges and into the eastern parts of the Richmond Range. This occurs far less frequently than Lismore flooding, with February 1954 and January 2008 the stand-out events for Casino, Kyogle and Wiangaree.
Heavy rainfall occurring over the generally flat country and eastern parts of the Richmond Range in the southwest of the catchment contributes to flooding at Coraki, Woodburn and downstream. Heavy rainfall on the southern side of the Alstonville Plateau also affects the Lower Richmond River.
Another part of the catchment is the Teven Valley and North Creek northwest and north of Ballina. Flooding can occur in this area during very heavy rainfall although those waters quickly enter the Richmond River.
Richmond River catchment map source
Lismore Flood Heights
 The Lismore flood gauge is on the rowing club building at the western end of Magellan
Street (red dot on the Lismore Map) and the figures below are all taken from that point. Australian Height
Datum (AHD) was introduced in the late 1990s. AHD flood height measurements are
0.78 metres lower than the old gauge readings that many readers may recall. Flood
heights in other parts of Lismore vary depending on a number of factors including
the volume and speed of water coming down the Wilsons River and Leycester Creeks,
the amount of local flooding due to heavy rain in Lismore, whether the Browns
Creek pump is operational and whether levees have or are being overtopped.
The Lismore flood gauge is on the rowing club building at the western end of Magellan
Street (red dot on the Lismore Map) and the figures below are all taken from that point. Australian Height
Datum (AHD) was introduced in the late 1990s. AHD flood height measurements are
0.78 metres lower than the old gauge readings that many readers may recall. Flood
heights in other parts of Lismore vary depending on a number of factors including
the volume and speed of water coming down the Wilsons River and Leycester Creeks,
the amount of local flooding due to heavy rain in Lismore, whether the Browns
Creek pump is operational and whether levees have or are being overtopped.
The Lismore central business district used to begin flooding when the Wilsons River reached 9.42m AHD. Water would flow into the streets near the old Post Office at the corner of Molesworth and Magellan streets. Major flows into the city would occur by 9.72m AHD with most of the CBD inundated when the river level reached 10.22m AHD.
A concrete wall flood levee was built over a couple of years and finished in March 2005. It protects the CBD from floods up to about 10.65m AHD. Flood waters during major events will still top the levee but will start to enter streets at the Browns Creek spillway on Molesworth Street between Woodlark and Zadoc streets. A long established earthen levee protects South Lismore from all but major floods exceeding 10.95m AHD. North Lismore has no flood protection and is the first area to be cut off.
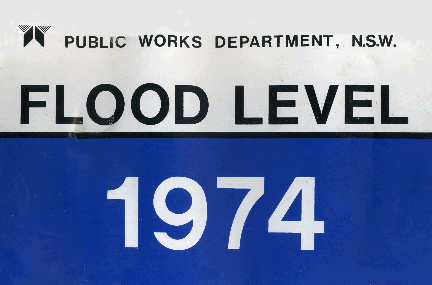
The highest recorded Lismore flood levels were on 21st February 1954 and 11th March 1974. Signs such as this one are displayed on power poles throughout the city to mark the highest level floodwaters reached.
Daily rainfall data from all Bureau of Meteorology sites in the Northern Rivers have been added for each flood event. ![]()
Tropical cyclone tracking map links are listed where it is known they directly or indirectly contributed to a flood event. Infrared satellite picture loops are available for all flood events since 1983.
| Bureau of Meterology flood levels (metres AHD) for the Wilsons River at Lismore |
Minor: 4.2 |
Moderate: 7.2 |
Major: 9.7 |
| Metres | Date | Synoptic situation and notes. Links to daily rainfall data are provided where available. | Weather Maps & Satellite Photos | |
8.30 |
22nd January | 1893 | ---> Daily rainfall data for this event | |
11.14 |
February | 1893 | February 1893 is still to this day Lismore's wettest month with 799mm on 27 raindays. Floods were likely 11-12 Feb and also 16-18 Feb.
---> Daily rainfall data for this event |
|
8.77 |
8-10th November | 1917 | Heaviest falls were on the 9th: Dunoon 254, Maclean 228, Mullumbimby 234, Tweed Head 342, Clunes 225
---> Daily rainfall data for this event |
|
8.13 |
15-17th May | 1921 | ---> Daily rainfall data for this event | |
10.79 |
22-24th July | 1921 | Rainfall data suggests the major flood in 1921 would have been May - perhaps the flood heights for May and July have been reversed ?
---> Daily rainfall data for this event |
|
n/a |
5-18th March | 1925 | Prolonged flooding with possible multiple peaks in the moderate range
---> Daily rainfall data for this event |
|
n/a |
24-28th January | 1927 | Possible minor flood on the 11th with moderate flooding from the 24th
---> Daily rainfall data for this event |
|
5.42 |
6-16th February | 1928 | ---> Daily rainfall data for this event | |
7.75 |
1-2nd March | 1929 | ---> Daily rainfall data for this event | |
5.32 |
30th June | 1929 | ---> Daily rainfall data for this event | |
10.96 |
3-7th February | 1931 | ---> Daily rainfall data for this event | |
n/a |
9th May | 1934 | This event is not listed in the archives. Rainfall figures suggest a moderate flood was likely.
---> Daily rainfall data for this event |
|
5.53 |
8-17th March | 1937 | Probably two peaks: 10th and 17th
---> Daily rainfall data for this event |
|
8.07 |
17-21st January | 1938 | ---> Daily rainfall data for this event | |
8.09 |
10-12th April | 1938 | ---> Daily rainfall data for this event | |
8.71 |
22-27th May | 1938 | ---> Daily rainfall data for this event | |
7.96 |
4-6th March | 1939 | ---> Daily rainfall data for this event | |
n/a |
2-3rd December | 1940 | ---> Daily rainfall data for this event | |
n/a |
30-31st December | 1943 | ---> Daily rainfall data for this event | |
n/a |
26-29th January | 1944 | ---> Daily rainfall data for this event | |
11.29 |
11th June | 1945 | Mostly likely an East Coast Low. Rain stopped 6pm Monday. Worst in history. Browns Ck
raging torrent over Spinks Bridge. River peak may be higher than this.
---> Daily rainfall data for this event |
|
6.18 |
25th March | 1946 | ---> Daily rainfall data for this event | |
6.69 |
2nd May | 1948 | ---> Daily rainfall data for this event | [Surface] [Upper] |
10.74 |
15-18th June | 1948 | Peak most likely evening of 16th
---> Daily rainfall data for this event |
[Surface] [Upper] |
5.37 |
1st March | 1950 | Prolonged period of wet weather which eventually led to a minor flood peak.
---> Daily rainfall data for this event |
[Surface] [Upper] |
9.48 |
24th June | 1950 | ---> Daily rainfall data for this event | [Surface] [Upper] |
8.87 |
27th January | 1951 | ---> Daily rainfall data for this event | [Surface] [Upper] |
7.81 |
18-20th March | 1951 | ---> Daily rainfall data for this event | [Surface] [Upper] |
5.54 |
8th June | 1951 | ---> Daily rainfall data for this event | [Surface] [Upper] |
9.51 |
21st February | 1953 | Creeping flood from a prolonged period of very wet weather.
---> Daily rainfall data for this event |
[Surface] [Upper] |
7.21 |
20-24th March | 1953 | ---> Daily rainfall data for this event | [Surface] [Upper] |
12.17 |
5am 21st February | 1954 | Rain depression
from ex TC on 9-11th, then Tropical
Cyclone 195303 from midday Friday to early Sunday morning. '54 Flood Disaster.
Clear skies Sunday. All communications failed. Highest ever peak Lismore (maybe
12.63m), Kyogle, Casino, Nimbin and Murwillumbah. Some locations had over 1,000mm of rain in 12 days.
---> Daily rainfall data for this event |
[Surface] [Upper] |
8.95 |
14th July | 1954 | ---> Daily rainfall data for this event | [Surface] [Upper] |
8.92 |
29th March | 1955 | ---> Daily rainfall data for this event | [Surface] [Upper] |
6.02 |
5-6th April | 1955 | Low presure system that caused the previous flood a week ago returned.
---> Daily rainfall data for this event |
[Surface] [Upper] |
7.14 |
1st May | 1955 | ---> Daily rainfall data for this event | [Surface] [Upper] |
6.98 |
11-13th December | 1955 | ---> Daily rainfall data for this event | [Surface] [Upper] |
11.54 |
11pm 18th February | 1956 | Rain event earlier in the month then a tropical
low moving S-SW. Robert White bridge collapsed. Sudden stop to
rain Saturday afternoon. Sensational rise in creek levels at Nimbin.
---> Daily rainfall data for this event |
[Surface] [Upper] |
5.67 |
19-20th June | 1958 | Rainfall data suggests flooding around the 11th as well - perhaps two peaks occurred.
---> Daily rainfall data for this event |
[Surface] [Upper] |
7.07 |
6-7th August | 1958 | ---> Daily rainfall data for this event | [Surface] [Upper] |
8.14 |
21-24th January | 1959 | Tropical
Cyclone Beatrice
---> Daily rainfall data for this event |
[Surface] [Upper] |
8.15 |
17-20th February | 1959 | ---> Daily rainfall data for this event | [Surface] [Upper] |
n/a |
18-29th March | 1959 | ---> Daily rainfall data for this event | [Surface] [Upper] |
7.22 |
9-13th November | 1959 | ---> Daily rainfall data for this event | [Surface] [Upper] |
7.17 |
18-20th February | 1961 | ---> Daily rainfall data for this event | [Surface] [Upper] |
6.13 |
6-8th January | 1962 | Rainfall data indicates another minor flood peak was likely on the 15th.
---> Daily rainfall data for this event |
[Surface] [Upper] |
7.02 |
7-9th April | 1962 | ---> Daily rainfall data for this event | [Surface] [Upper] |
11.36 |
11am 11th July | 1962 | Cyclonic depression
off Gold Coast. Highest ever peak Repentance Ck, The Channon, Bentley. Flood firsts
- NRTV, Northern Star uninterrupted production.
---> Daily rainfall data for this event |
[Surface] [Upper] |
5.74 |
1-2nd January | 1963 | ---> Daily rainfall data for this event | [Surface] [Upper] |
6.11 |
15-18th March | 1963 | ---> Daily rainfall data for this event | [Surface] [Upper] |
5.29 |
26-28th April | 1963 | ---> Daily rainfall data for this event | [Surface] [Upper] |
11.06 |
7pm 8th May | 1963 | Trough in central
western districts. Upper low then surface low off Cape Byron Tuesday night. All
North Coast flooded. Equal highest peak Bentley. This flood followed a
minor flood just 10 days earlier.
---> Daily rainfall data for this event |
[Surface] [Upper] |
5.51 |
26-27th March | 1964 | Some heavy rainfalls also occurred between the 8th and 10th March
---> Daily rainfall data for this event |
[Surface] [Upper] |
10.43 |
1am 21st July | 1965 | Very cold southerly,
then rain depression moving south. Possibly similar to September 1988. Only 6 raindays
in whole month. Worst drought in years. Deepfreeze over state. Snow in Sydney.
1st flood for the Tuckombil Flood Canal. Waterspout off Cape Byron.
---> Daily rainfall data for this event |
[Surface] [Upper] |
5.51 |
9-11th June | 1966 | ---> Daily rainfall data for this event | [Surface] [Upper] |
10.27 |
11am 19th March | 1967 | Tropical Cyclone
Elaine and another tropical low operationally classified tropical cyclone "Dulcie" combined. Record floods in north Queensland.
---> Daily rainfall data for this event |
[Surface] [Upper] |
8.20 |
3am 13th June | 1967 | Lows off SE Queensland
coast. 1030hp high
---> Daily rainfall data for this event |
[Surface] [Upper] |
9.49 |
4pm 14th June | 1967 | Lows off SE Queensland
coast. 1030hp high. Worst flooding on the Gold Coast in 25yrs. Grafton badly hit.
2nd peak in Lismore.
---> Daily rainfall data for this event |
[Surface] [Upper] |
5.09 |
11am 23rd June | 1967 | Another low off
the coast moving quickly south.
---> Daily rainfall data for this event |
[Surface] [Upper] |
6.79 |
2am 28th June | 1967 | Complex trough
and depression off coast near Cape Byron. 1030hp high. Seas batter coast. 4th
June flood peak.
---> Daily rainfall data for this event |
[Surface] [Upper] |
5.75 |
10-13th January | 1968 | ---> Daily rainfall data for this event | [Surface] [Upper] |
6.69 |
8-10th December | 1970 | ---> Daily rainfall data for this event | [Surface] [Upper] |
6.41 |
17-19th February | 1971 | ---> Daily rainfall data for this event | [Surface] [Upper] |
9.43 |
6pm 13th February | 1972 | Tropical Cyclones
Daisy and Wendy.
1036hp high. Severe beach erosion. 1st test for Browns Creek Pump which cut the flood peak by feet.
---> Daily rainfall data for this event |
[Surface] [Upper] |
5.67 |
8-9th March | 1972 | ---> Daily rainfall data for this event | [Surface] [Upper] |
5.07 |
3-4th April | 1972 | Tropical Cyclone Emily
---> Daily rainfall data for this event |
[Surface] [Upper] |
10.09 |
6am 29th October | 1972 | Upper disturbance
---> low in north of state. 1030hp high. First October flood. Browns Ck Pump kept
water 1m lower in basin. Record rainfalls for year and month.
---> Daily rainfall data for this event |
[Surface] [Upper] |
5.62 |
14-17th February | 1973 | Daily rainfall data for this event | [Surface] [Upper] |
9.13 |
6pm 27th January | 1974 | Tropical
Cyclone Wanda and intense rain depression moving SE from NW Queensland. Australia
Day Flood. Massive flooding in Brisbane - worst of the century.
---> Daily rainfall data for this event |
[Surface] [Upper] |
12.17 |
am 11th March | 1974 | Upper disturbance
and very small localised low pressure. 1028hp high. '74 Flood. South Lismore levee
breached. Shock flood worst ever. Highest ever peaks Wyrallah, Tuckarimba, Coraki,
Woodburn, Bungawalbyn. Brisbane 2nd Flood.
---> Daily rainfall data for this event |
[Surface] [Upper] |
9.81 |
am 13th March | 1974 | Tropical
Cyclone Zoe moving rapidly south. '74 Flood - second hit.
---> Daily rainfall data for this event |
[Surface] [Upper] |
8.97 |
3pm 23rd April | 1974 | Upper disturbances
in north of state. 1030hp high.
---> Daily rainfall data for this event |
[Surface] [Upper] |
7.52 |
4pm 3rd June | 1974 | 1030hp high. Small
low off border. Flood peril returns. 10 years to recover.
---> Daily rainfall data for this event |
[Surface] [Upper] |
10.53 |
12pm 3rd March | 1975 | Upper disturbance
then surface low off the coast. 1030hp high. SES spot on with predictions. Waterspout or tornado Lennox Head.
---> Daily rainfall data for this event |
[Surface] [Upper] |
7.62 |
6am 12th February | 1976 | Tropical depression
moving across country. ex TC. Weak high. Tabulam devastated - worst flood ever.
---> Daily rainfall data for this event |
[Surface] [Upper] |
10.14 |
9am 29th February | 1976 | Upper disturbances.
NE winds from weak high then Tropical
Cyclone Colin. Leap year flood. Wilsons river currents - 4ft/hr rise. Sirens
used. Teven devastated. Highest ever peak Nashua, Eltham, Tatham. Federal recorded 290mm of rain in just 4 hours.
---> Daily rainfall data for this event |
[Surface] [Upper] |
9.97 |
12pm 19th March | 1978 | 1034hp high cradling
deepening low moving SW. Mt Nardi Deluge - 660mm
---> Daily rainfall data for this event |
[Surface] [Upper] |
9.53 |
7am 10th May | 1980 | Strengthening
high and small low moving S. Rain a boost to district - a lot more needed though.
---> Daily rainfall data for this event |
[Surface] [Upper] |
8.18 |
4pm 23rd June | 1983 | 1028hp high, upper
disturbance and small low moving S. 1st satellite photos in paper.
---> Daily rainfall data for this event |
[Satellite] [Surface] [Upper] |
9.84 |
1am 10th April | 1984 | Ex-Tropical
Cyclone Lance and northern NSW low. 1030hp high. Gales. Major flood a close thing. House With No Steps losses great.
---> Daily rainfall data for this event |
[Satellite] [Surface] [Upper] |
10.43 |
8am 6th March | 1987 | Small low off
Tweed Heads which formed from Ex TC 'Elsie' after it crossed country. 1030hp high.
Lismore ready for major flood. Worst since 74. Rocky Ck dam full. Drought preceded
flood - especially on Gold Coast.
---> Daily rainfall data for this event |
[Satellite] [MSL Charts] [Surface] [Upper] |
10.78 |
8am 11th May | 1987 | Slow moving 1037hp
high and upper air disturbance. Mothers Day Flood. 2nd major inundation in 2 months
- only year to have two major floods.
Flood Pictures: [11th May 1987] ---> Daily rainfall data for this event |
[Satellite] [MSL Charts] [Surface] [Upper] |
9.10 |
10am 7th April | 1988 | Tropical low moving
across country -> upper disturbances and lows off SE Queensland. Easter Flood.
Floods in red centre, NSW and QLD
---> Daily rainfall data for this event |
[Satellite] [Surface] [Upper] |
9.46 |
5pm 12th April | 1988 | Small low and
upper disturbance. 1038hp high. Longest flood. Woodburns worst - not highest.
2nd peak in Lismore in a week.
---> Daily rainfall data for this event |
[Satellite] [Surface] [Upper] |
4.42 |
6th June | 1988 | ---> Daily rainfall data for this event | [Satellite] [Surface] [Upper] |
6.94 |
11pm 16th September | 1988 | Deepening low
moving down coast. 1030hp ridging high. Rain stopped just in time. First September
flood.
---> Daily rainfall data for this event |
[Satellite] [Surface] [Upper] |
4.72 |
19th December | 1988 | ---> Daily rainfall data for this event | [Satellite] [Surface] [Upper] |
5.22 |
29th January | 1989 | Two weak lows
moving down coast. 1020hp high.
---> Daily rainfall data for this event |
[Satellite] [Surface] [Upper] |
11.28 |
11am 2nd April | 1989 | Multiple upper
disturbances. Slow moving 1037hp high. April Fools Day Flood. Leycester Ck pushed
back Wilsons. Incredible rise of river. South Lismore levee breached. Oil flood.
Tropical
Cyclone Aivu North QLD.
---> Daily rainfall data for this event |
[Satellite] [Surface] [Upper] |
9.15 |
6am 27th April | 1989 | Upper low then
deepening surface low moving down coast. 1034hp high weakening. 2nd flood in a
month. Cyclonic wind - Easterly then calm then Westerly.
Flood Pictures: [27th April 1989] ---> Daily rainfall data for this event |
[Satellite] [Surface] [Upper] |
8.10 |
pm 3rd February | 1990 | Tropical
Cyclone Nancy with well developed upper trough extending to Victoria along the East Coast. 1026hp high over NZ and 1034hp high over Bight. Major flooding in Sydney and Hunter Valley. Eye of tropical cyclone crossed Cape Byron - winds were calm for a short time.
---> Daily rainfall data for this event |
[Satellite] [Surface] [Upper] |
5.72 |
am 7th April | 1990 | Upper air disturbance from ex TC Ivor, and 1036hp high centred in the Tasman Sea. Minor flooding in Lismore but moderate flooding on the Clarence River. The remains of TC Ivor as an upper low, continued
for two more weeks and caused the worst flooding ever for western NSW and Qld.
---> Daily rainfall data for this event |
[Satellite] [Surface] [Upper] |
7.27 |
2pm 13th December | 1991 | Slow moving front
and upper air disturbance combined to form an east coast low, which then moved
south. 1026hp high in the Tasman Sea. Moderate flooding in Lismore and Murwillumbah.
Two deaths. Heavy rain for only 24 hours. Severe flooding at Nimbin with 300mm
in one night caused some of the worst flooding ever there.
---> Daily rainfall data for this event |
[Satellite] [Surface] [Upper] |
5.75 |
4th March | 1994 | ---> Daily rainfall data for this event | [Satellite] [Surface] [Upper] |
6.76 |
16th February | 1995 | ---> Daily rainfall data for this event | [Satellite] [Surface] [Upper] |
7.12 |
9pm 3rd May | 1996 | A few locations along the Border Ranges received around 1,000mm of rain in a week.
---> Daily rainfall data for this event |
[Satellite] [MSL Charts] [Upper] |
7.78 |
11am 7th May | 1996 | 2nd peak at Lismore. Rainfall figures reveal another rainfall event around 17th May but it was fairly coastal in extent.
---> Daily rainfall data for this event |
[Satellite] [MSL Charts] [Upper] |
5.20 |
11pm 14th January | 2000 | Heaviest falls were on the 14th: McLeans Ridges 152, Lismore 119, Wollongbar 171, Alstonville 179, The Channon 150
---> Daily rainfall data for this event |
[Satellite] [MSL Charts] [Upper] |
10.42 |
6pm 2nd February | 2001 | First major flood in Lismore for 12 years - this was the last straw in getting the flood levee constructed. Many locations received over 400mm of rain in 36 hours.
Flood Pictures: [1st Feb 2001] [2nd Feb 2001] [Major Flooding in Lismore Report] ---> Daily rainfall data for this event |
[Satellite] [MSL Charts] [Upper] |
8.34 |
10th March | 2001 | Flood pictures: [9th Mar 2001]
[10th Mar 2001]
---> Daily rainfall data for this event |
[Satellite] [MSL Charts] [Upper] |
7.50 |
12pm 6th March | 2004 | ---> Daily rainfall data for this event | [Satellite] [MSL Charts] [Upper] |
10.20 |
10pm 30th June | 2005 | Flood pictures: [30th Jun 2005]
[1st Jul 2005] [Major Flooding of the Wilsons River Lismore Report]
---> Daily rainfall data for this event |
[Satellite] [MSL Charts] [Upper] |
7.85 |
12pm 20th January | 2006 | Flood pictures: [19th Jan 2006]
[20th Jan 2006] [21st Jan 2006]
---> Daily rainfall data for this event |
[Satellite] [MSL Charts] [Upper] |
5.95 |
1pm 6th March | 2006 | Flood Pictures: [4th March 2006]
---> Daily rainfall data for this event |
[Satellite] [MSL Charts] [Upper] |
9.40 |
6pm 5th January | 2008 | Although the river peak in Lismore failed to reach the major level, elsewhere in the district it was the biggest flood since 1954. The entire catchment was saturated from days of rain, then further extreme rainfalls fell in the Tweed and Upper Richmond rivers during the evening of Friday 4th January.
Flood Pictures: [4th Jan 2008] [5th Jan 2008] [6th Jan 2008] [7th Jan 2008] [8th Jan 2008] [9th Jan 2008] ---> Daily rainfall data for this event |
[Satellite] [MSL Charts] [Upper] |
10.38 |
2-3pm 22nd May | 2009 | This event was very well forecast by the weather models many days before it occurred. A slow moving upper low moving over western NSW and central/southern QLD, along with a blocking Southern Tasman Sea high with deep onshore flow onto the East Coast resulted in a persistent coastal trough/low setup. Several intense meso-lows formed in the trough and brought very heavy rain and destructive winds - particularly to the Northern Rivers region on Thursday 21st. Major river and flash flooding occurred between the Queensland Sunshine Coast and Port Macquarie between Wednesday 20th to Sunday 24th May. In Lismore, the new levee once again saved the main part of the central business district from inundation - but only just - another hour of heavy rainfall and it would have over-topped. Flooding was major in the Wilsons, Richmond and Clarence rivers, with the Tweed and Brunswick Valley not as badly hit. Flood Pictures: [21st May 2009] [22nd May 2009]
---> Daily rainfall data for this event |
[MSL Charts] |
4.57 |
6am 12th October | 2010 | Heavy falls in the eastern part of the catchment on 3rd and 4th of October were followed by a second rain event less than a week later. A strong high pressure was anchored in the Tasman Sea. A mid level trough in the southern Coral Sea tracked westward and crossed the coast during the morning of the 11th. This time the heaviest falls were in SE QLD however local rainfall was enough to push the Wilsons River in Lismore to minor flood levels. | |
| Metres | Date | Synoptic situation and notes. Links to daily rainfall data are provided where available. | Weather Maps & Satellite Photos |
top of page
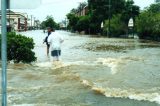
Flood Pictures
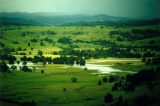
The Mother's Day Flood: Lismore was hit with an unprecedented second major
flood event in the space of two months. These flood pictures were taken overlooking
the Lismore basin then around the central business district. The flood peak had
dropped about 20cm by this time.
Two floods in one month! After the biggest flood since 1974 hit the region
on 2nd April 1989, a second flood for the same calendar month occurred. A few
photos were taken near the Lismore rowing club and Browns Creek pump.
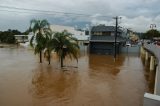
Major flooding returns to the Lismore region - it had been 12 years since the
last major flood to hit Lismore. This CBD inundation proved to be the final straw
to get the Lismore flood levee built. The pictures on the 1st were taken near
Eltham, and on the 2nd near Eltham and in the Lismore CBD.
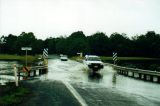
Major flooding along the Clarence River occurred this time with a smaller event
in Lismore. The flood photos are taken of the Wilsons River at Eltham and along
the Bangalow Road leading into Lismore.
Just three months after the Lismore CBD flood levee was finished, it was given
its first test. Major flooding peaked at the low end of the major level. It illustrated
how well the levee worked in protecting the CBD from 90 per cent of floods that
occur in the region. The flood photographs are taken near Eltham and around Lismore.
Moderate flooding along the Wilsons River into Lismore with a major flood
in the Brunswick Valley. The pictures are taken around Eltham and Lismore.
Moderate flooding and wild seas occurred due to an intense low off the coast.
The river peak in Lismore was quite slow to arrive with floodwaters persisting
from the 4th to the 6th. The pictures are taken near Eltham and the Tweed Coast.
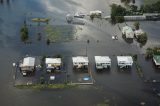
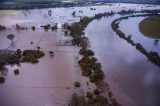
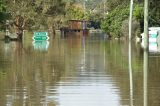
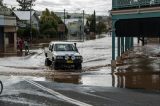
5th January 2008
Major flooding occurred along the Richmond River in January 2008 with Kyogle
hit hard. Lismore was lucky and only saw moderate flooding. Most low lying areas
along the Richmond River were inundated with some record stream rises.
[4th Jan 2008
Flood Pictures] taken from McLeans Ridges, Eltham, Boatharbour and Lismore.
Major flooding occurred along the Wilsons, Richmond and Clarence rivers in May 2009. The Lismore flood levee protected most of the central business district from inundation.
 11th May 1987
[11th May 1987 Pictures]
 27th April 1989
[27th April 1989 Pictures]
 2nd February 2001
[1st Feb 2001 Pictures]
[2nd Feb 2001 Pictures]
[Event Report]
 10th March 2001
[9th Mar 2001 Pictures]
[10th Mar 2001 Pictures]
 30th June 2005
[30th Jun 2005 Pictures]
[1st Jul 2005 Pictures]
[Event Report]
 20th January 2006
[19th Jan 2006 Pictures]
[20th Jan 2006 Pictures]
[21st Jan 2006 Pictures]
 6th March 2006
[4th March 2006 Pictures]

[5th Jan 2008 Flood
Pictures] taken at South Lismore, Fairy Hill, Casino, Leycester, Rock Valley,
Kyogle and Lismore.
[6th Jan 2008 Flood
Pictures] taken McKees Hill to Clovass on the Bruxner Hwy.
[7th Jan 2008 Flood
Pictures] taken from a NSW State Emergency Service (SES) helicopter between
Lismore and Coraki including stranded cattle rescued along the Wilsons River near
Coraki.
[8th Jan 2008 Flood
Pictures] taken between Lismore and Coraki from the SES chopper, and at Coraki.
[9th Jan 2008 Flood
Pictures] taken around Coraki from the SES helicopter then during two SES flood
boat operations.
 22nd May 2009
[21st May 2009 Flood Pictures] taken from McLeans Ridges, Eltham and Booyong.
[22nd May 2009 Flood Pictures] taken at McLeans Ridges, Eltham, Goonellabah, Lismore, South Lismore and North Lismore
|
Document: lismore_flood_pictures_reports.htm
Updated: 12th October 2010 |
[Australian Severe Weather index] [Copyright Notice] [Email Contacts] [Search This Site] |