 Markers:
Show
Hide
Markers:
Show
Hide
Mouse-over the markers to view the TC name, click the marker to load the individual map.
| Tropical Cyclones
[Index] | Australian Region Tropical Cyclone Season 2025-2026 | ||
| Season 2025-2026 Summaries: [BoM-AU] | |||
|
Mouse-over the markers to view the TC name, click the marker to load the individual map.
Markers:
Show
Hide
|
Bureau of Meteorology (BoM) Tropical Cyclone Data
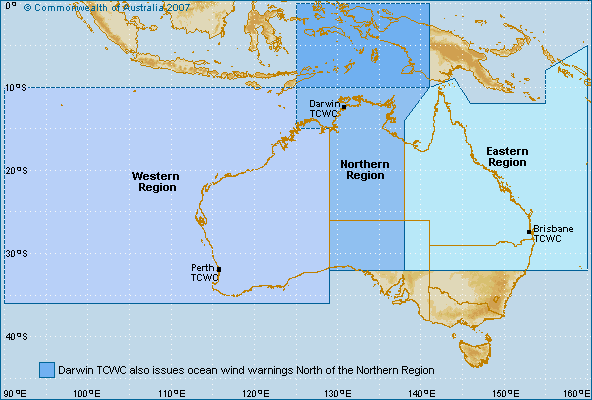
Generally includes all tropical cyclones if the track commenced or moved into the Australian warning areas (between 90 E and 160 E). |
| Cyclone Name | Map ID |
Cyclone Number |
Basin | Date Range (UTC) | Min CP |
Max Winds |
Tracking Map and data |
|---|---|---|---|---|---|---|---|
| FINA | 1 | 1100 / 202526_02 | SIO | 15 Nov 2025 - 26 Nov 2025 | 938 | 105 | Tropical Cyclone FINA |
| GRANT | 2 | 1101 / 202526_03 | SIO | 15 Dec 2025 - 27 Dec 2025 | 986 | 55 | Tropical Cyclone GRANT |
| BAKUNG | 3 | 1102 / 202526_05 | SIO | 10 Dec 2025 - 18 Dec 2025 | 957 | 90 | Tropical Cyclone BAKUNG |
| HAYLEY | 4 | 1103 / 202526_08 | SIO | 27 Dec 2025 - 31 Dec 2025 | 952 | 90 | Tropical Cyclone HAYLEY |
| IGGY | 5 | 1104 / 202526_10 | SIO | 31 Dec 2025 - 04 Jan 2026 | 997 | 40 | Tropical Cyclone IGGY |
| JENNA | 6 | 1105 / 202526_11 | SIO | 03 Jan 2026 - 08 Jan 2026 | 967 | 80 | Tropical Cyclone JENNA |
| KOJI | 7 | 1106 / 202526_12 | SPAC | 07 Jan 2026 - 14 Jan 2026 | 989 | 55 | Tropical Cyclone KOJI |
| LUANA | 8 | 1107 / 202526_16 | SIO | 21 Jan 2026 - 28 Jan 2026 | 986 | 50 | Tropical Cyclone LUANA |
| MITCHELL | 9 | 1108 / 202526_21 | both | 29 Jan 2026 - 10 Feb 2026 | 965 | 75 | Tropical Cyclone MITCHELL |
| 202526_28 | 10 | 1109 / 202526_28 | SIO | 28 Feb 2026 - 06 Mar 2026 | 990 | 45 | Tropical Cyclone 202526_28 |
| 202526_29 | 11 | 1110 / 202526_29 | SPAC | 02 Mar 2026 - 08 Mar 2026 | 995 | 35 | Tropical Cyclone 202526_29 |
| 202526_30 | 12 | 1111 / 202526_30 | SIO | 03 Mar 2026 - 12 Mar 2026 | 992 | 35 | Tropical Cyclone 202526_30 |
| NARELLE | 13 | 1112 / 202526_34 | both | 15 Mar 2026 - 28 Mar 2026 | 925 | 115 | Tropical Cyclone NARELLE |
| MAILA | 14 | 1113 / 202526_37 | SPAC | 01 Apr 2026 - 12 Apr 2026 | 924 | 115 | Tropical Cyclone MAILA |
Minimum central pressure (CP) in hPa. Maximum winds are 10-min average in knots.
Tropical cyclone tracks developed by Michael Bath using data from the Bureau of Meteorology and Google Maps.
|
Document: bom_2025_2026_australian_region_tropical_cyclones.htm
Updated: 29 April 2026 [Australian Severe Weather index] [Copyright Notice] [Email Contacts] [Search This Site] [Privacy Policy] |