 Markers:
Show
Hide
Markers:
Show
Hide
Mouse-over the markers to view the TC name, click the marker to load the individual map.
| Tropical Cyclones
[Index] | Australian Region Tropical Cyclone Season 2020-2021 | ||
| Season 2020-2021 Summaries: [BoM-AU] [JTWC-AU] [JTWC-SIO] [JTWC-SPAC] [JTWC-SH] | |||
|
Mouse-over the markers to view the TC name, click the marker to load the individual map.
Markers:
Show
Hide
|
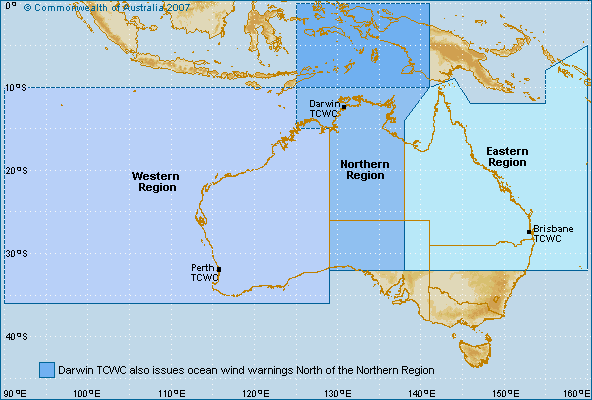
Bureau of Meteorology (BoM) Tropical Cyclone Data
Generally includes all tropical cyclones if the track commenced or moved into the Australian warning areas (between 90 E and 160 E). |
| Cyclone Name | Map ID |
Cyclone Number |
Basin | Date Range (UTC) | Min CP |
Max Winds |
Tracking Map and data |
|---|---|---|---|---|---|---|---|
| 202021_02 | 1 | 1034 / 202021_02 | SIO | 04 Dec 2020 - 11 Dec 2020 | 990 | 45 | Tropical Cyclone 202021_02 |
| IMOGEN | 2 | 1035 / 202021_05 | SPAC | 01 Jan 2021 - 04 Jan 2021 | 990 | 45 | Tropical Cyclone IMOGEN |
| JOSHUA | 3 | 1036 / 202021_07 | SIO | 13 Jan 2021 - 17 Jan 2021 | 990 | 45 | Tropical Cyclone JOSHUA |
| 202021_08 | 4 | 1037 / 202021_08 | SIO | 18 Jan 2021 - 23 Jan 2021 | 992 | 35 | Tropical Cyclone 202021_08 |
| KIMI | 5 | 1038 / 202021_09 | SPAC | 15 Jan 2021 - 19 Jan 2021 | 987 | 55 | Tropical Cyclone KIMI |
| 202021_10 | 6 | 1039 / 202021_10 | SIO | 19 Jan 2021 - 27 Jan 2021 | 994 | 40 | Tropical Cyclone 202021_10 |
| LUCAS | 7 | 1040 / 202021_11 | SPAC | 24 Jan 2021 - 03 Feb 2021 | 975 | 60 | Tropical Cyclone LUCAS |
| 202021_12 | 8 | 1041 / 202021_12 | SIO | 27 Jan 2021 - 08 Feb 2021 | 990 | 35 | Tropical Cyclone 202021_12 |
| MARIAN | 9 | 1042 / 202021_15 | SIO | 21 Feb 2021 - 09 Mar 2021 | 955 | 85 | Tropical Cyclone MARIAN |
| NIRAN | 10 | 1043 / 202021_17 | SPAC | 27 Feb 2021 - 05 Mar 2021 | 931 | 110 | Tropical Cyclone NIRAN |
| 202021_21 | 11 | 1044 / 202021_21 | SIO | 20 Mar 2021 - 26 Mar 2021 | 1000 | 35 | Tropical Cyclone 202021_21 |
| SEROJA | 12 | 1045 / 202021_22 | SIO | 02 Apr 2021 - 12 Apr 2021 | 971 | 65 | Tropical Cyclone SEROJA |
| ODETTE | 13 | 1046 / 202021_23 | SIO | 03 Apr 2021 - 10 Apr 2021 | 988 | 45 | Tropical Cyclone ODETTE |
Minimum central pressure (CP) in hPa. Maximum winds are 10-min average in knots.
Tropical cyclone tracks developed by Michael Bath using data from the Bureau of Meteorology and Google Maps.
|
Document: bom_2020_2021_australian_region_tropical_cyclones.htm
Updated: 6 February 2026 [Australian Severe Weather index] [Copyright Notice] [Email Contacts] [Search This Site] [Privacy Policy] |